


Instructor: Chana Messer
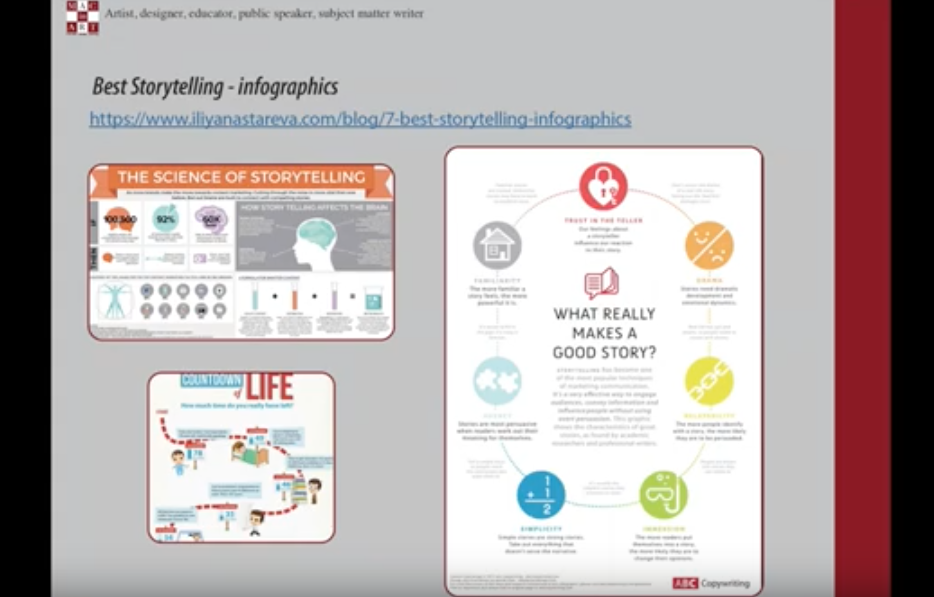
When you hear information, you’re likely to only remember 10% of it three days later. Add a relevant image to the information, and your retention jumps to 65%. Graphics help us weave a better and more memorable story. Everywhere you look today, people are using infographics not only to “support” a story, but to be the storyteller. We’ll show you how to create your own custom infographics in Adobe Illustrator.
By the end of this workshop, you’ll be able to do the following:
-Create / pull together vector assets
-Create different chart styles: bar, pie, line, etc.
-Layout your infographic
-Export and share your final product