


- This event has passed.
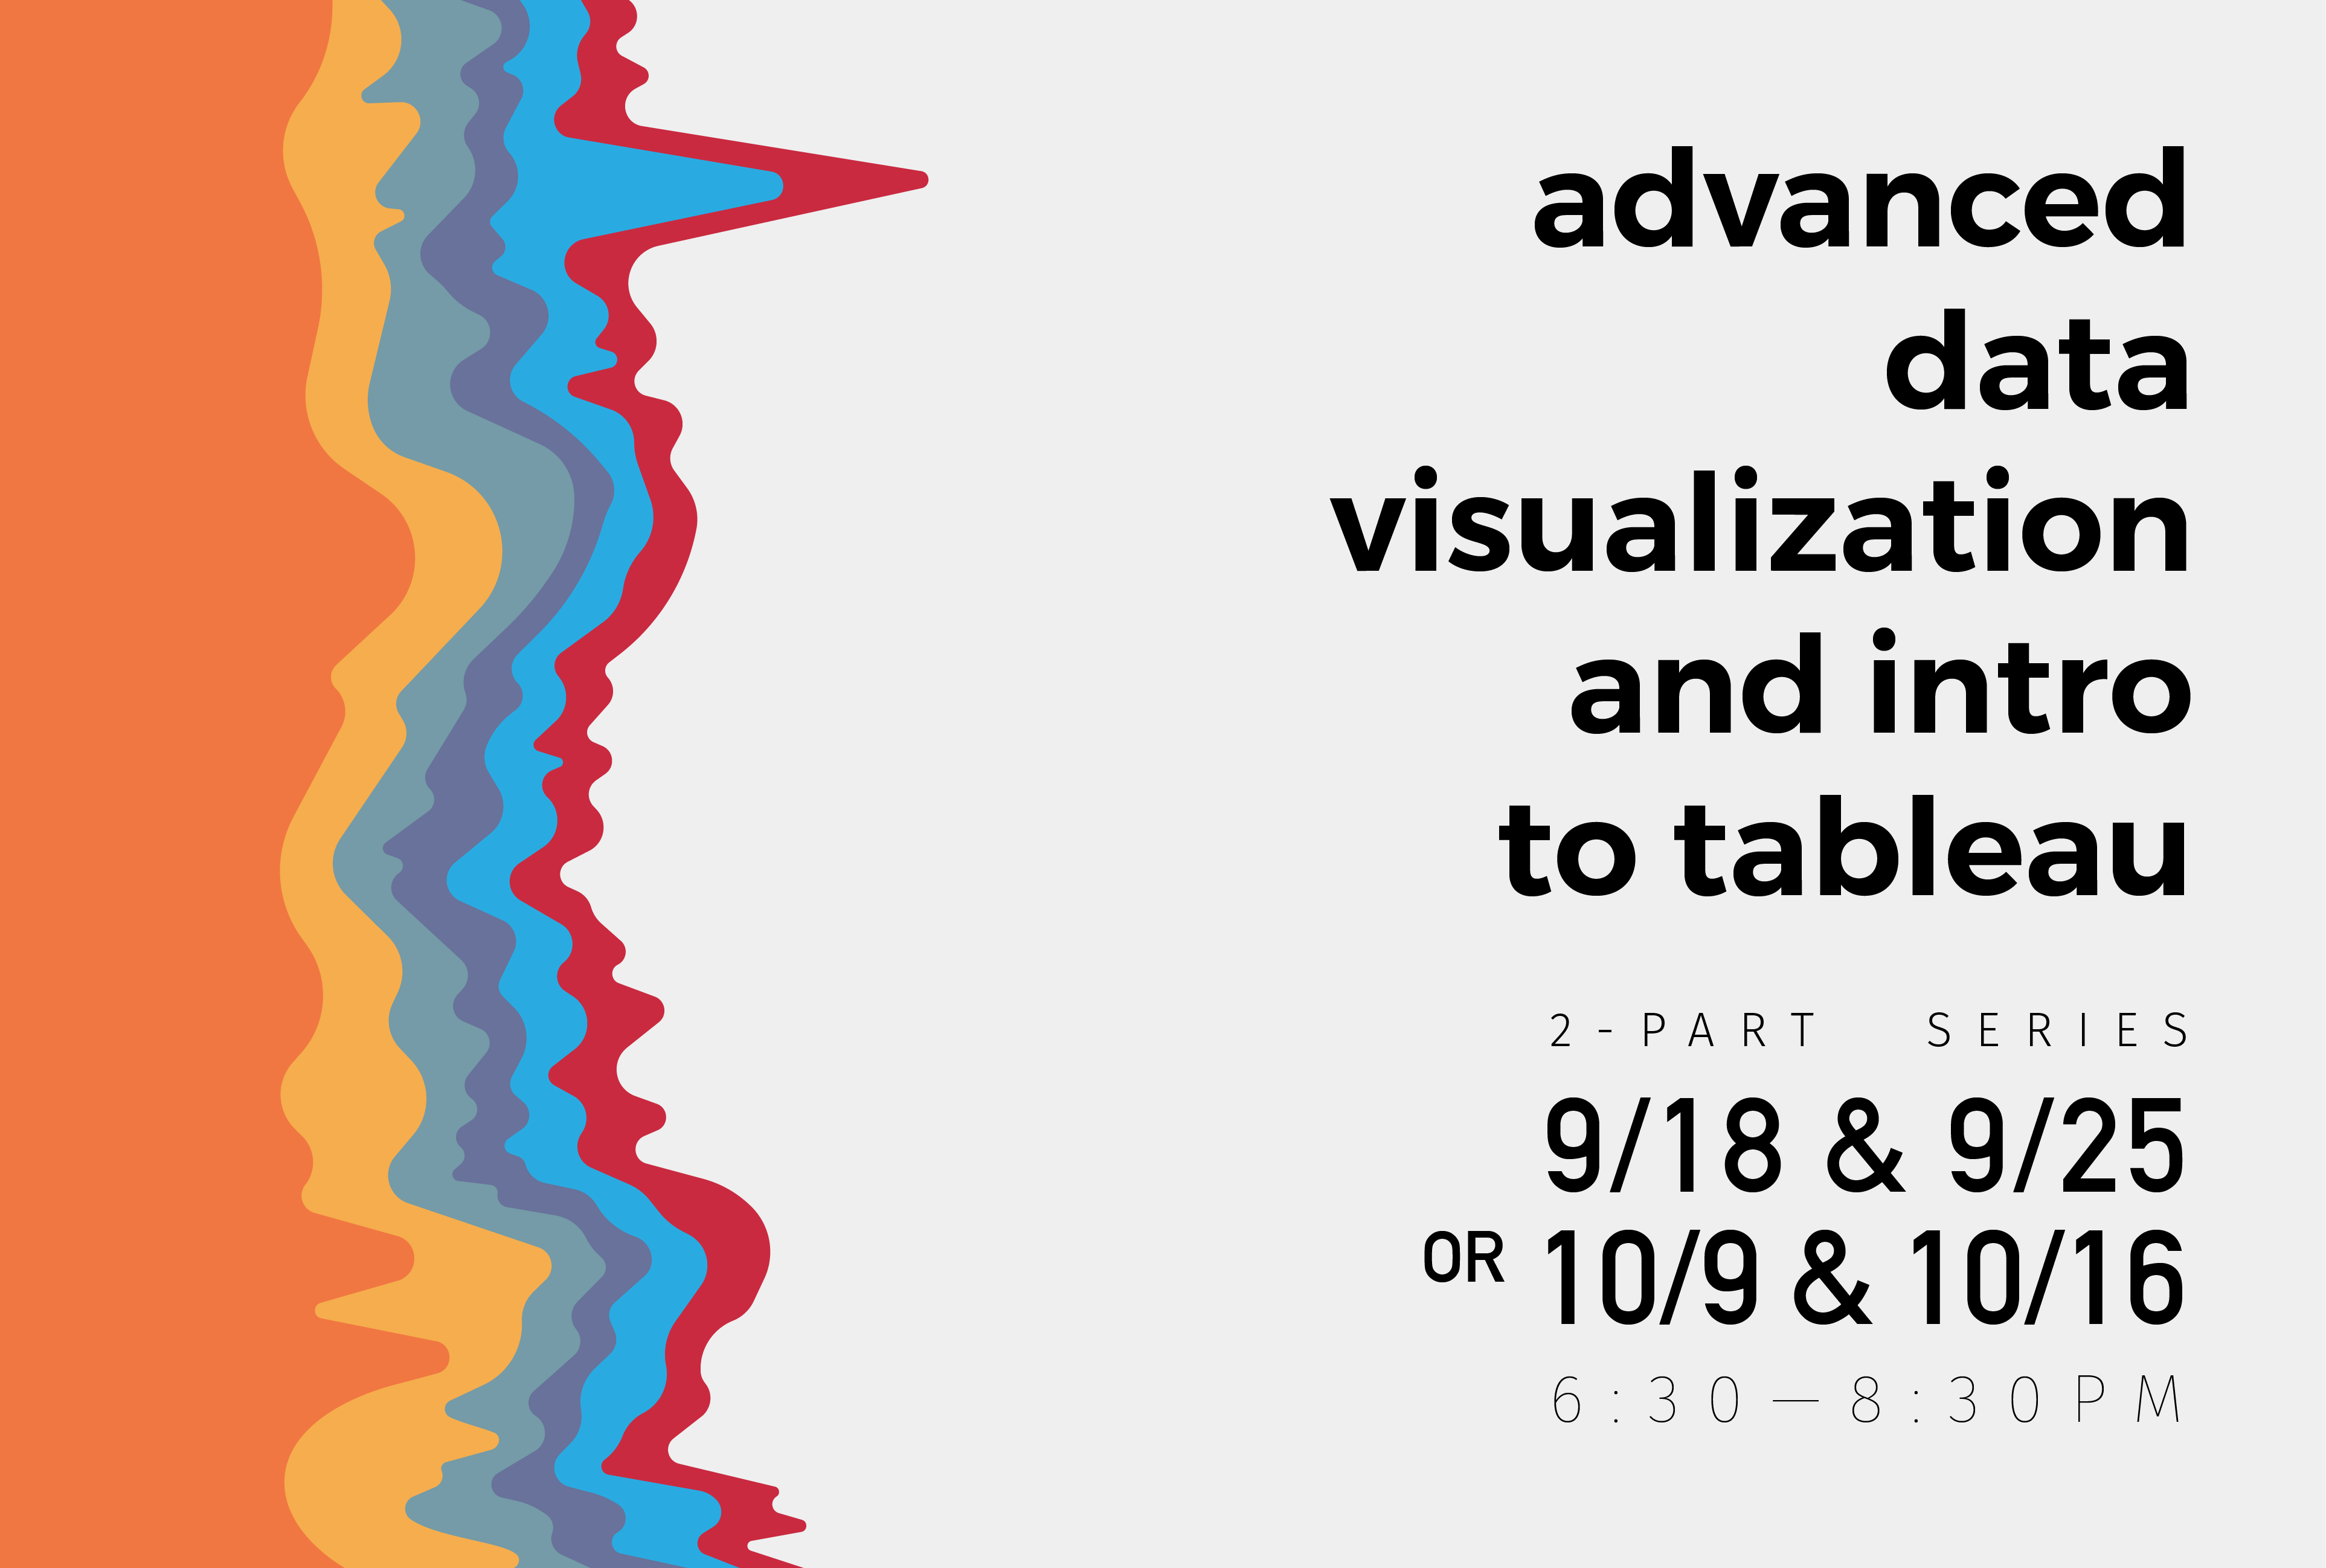
Advanced Data Visualization and Intro to Tableau – Part 1
October 9, 2017 @ 6:30 pm - 8:30 pm
For more updates on this event, check: https://www.facebook.com/pg/AnnenbergDL/events/
Data visualizations are a critical business tool. This workshop serves as an introduction to the visual techniques that are often employed when describing, analyzing, and communicating data in a business setting. We’ll start by explaining the role of data visualization in a business setting, and then dive into basic visual methodology.
In this class, we will dive deeper into chart types learned in the intro class, understanding how to customize them to meet their needs. We will also discuss chart selection and understanding which type of business problem should use which type of chart.
Please note, we will be using data from top companies like Netflix, Univision, Apple, etc. to build our Tableau stories.
Takeaways:
· Learn how to blend, join and build relationships between different data sources
· Learn simple level of detail (LOD) calculations
· Learn how to build bar charts, area charts, and heat maps to analyze data
· Learn the basic functions of Tableau to format, build dashboards and much more
· Connecting to data
· Measures v. Dimensions
· Tableau Tips and Tricks
· Fundamentals of Data Visualization
Prereqs:
· Please bring a laptop with Tableau Public (free) pre-installed
· Please download the data set for the workshop that will be sent out prior to class.
Instructor: Juanita Rodriguez
Note: This is the first part of a 2-part series. Don’t forget to RSVP to the second part!