


- This event has passed.
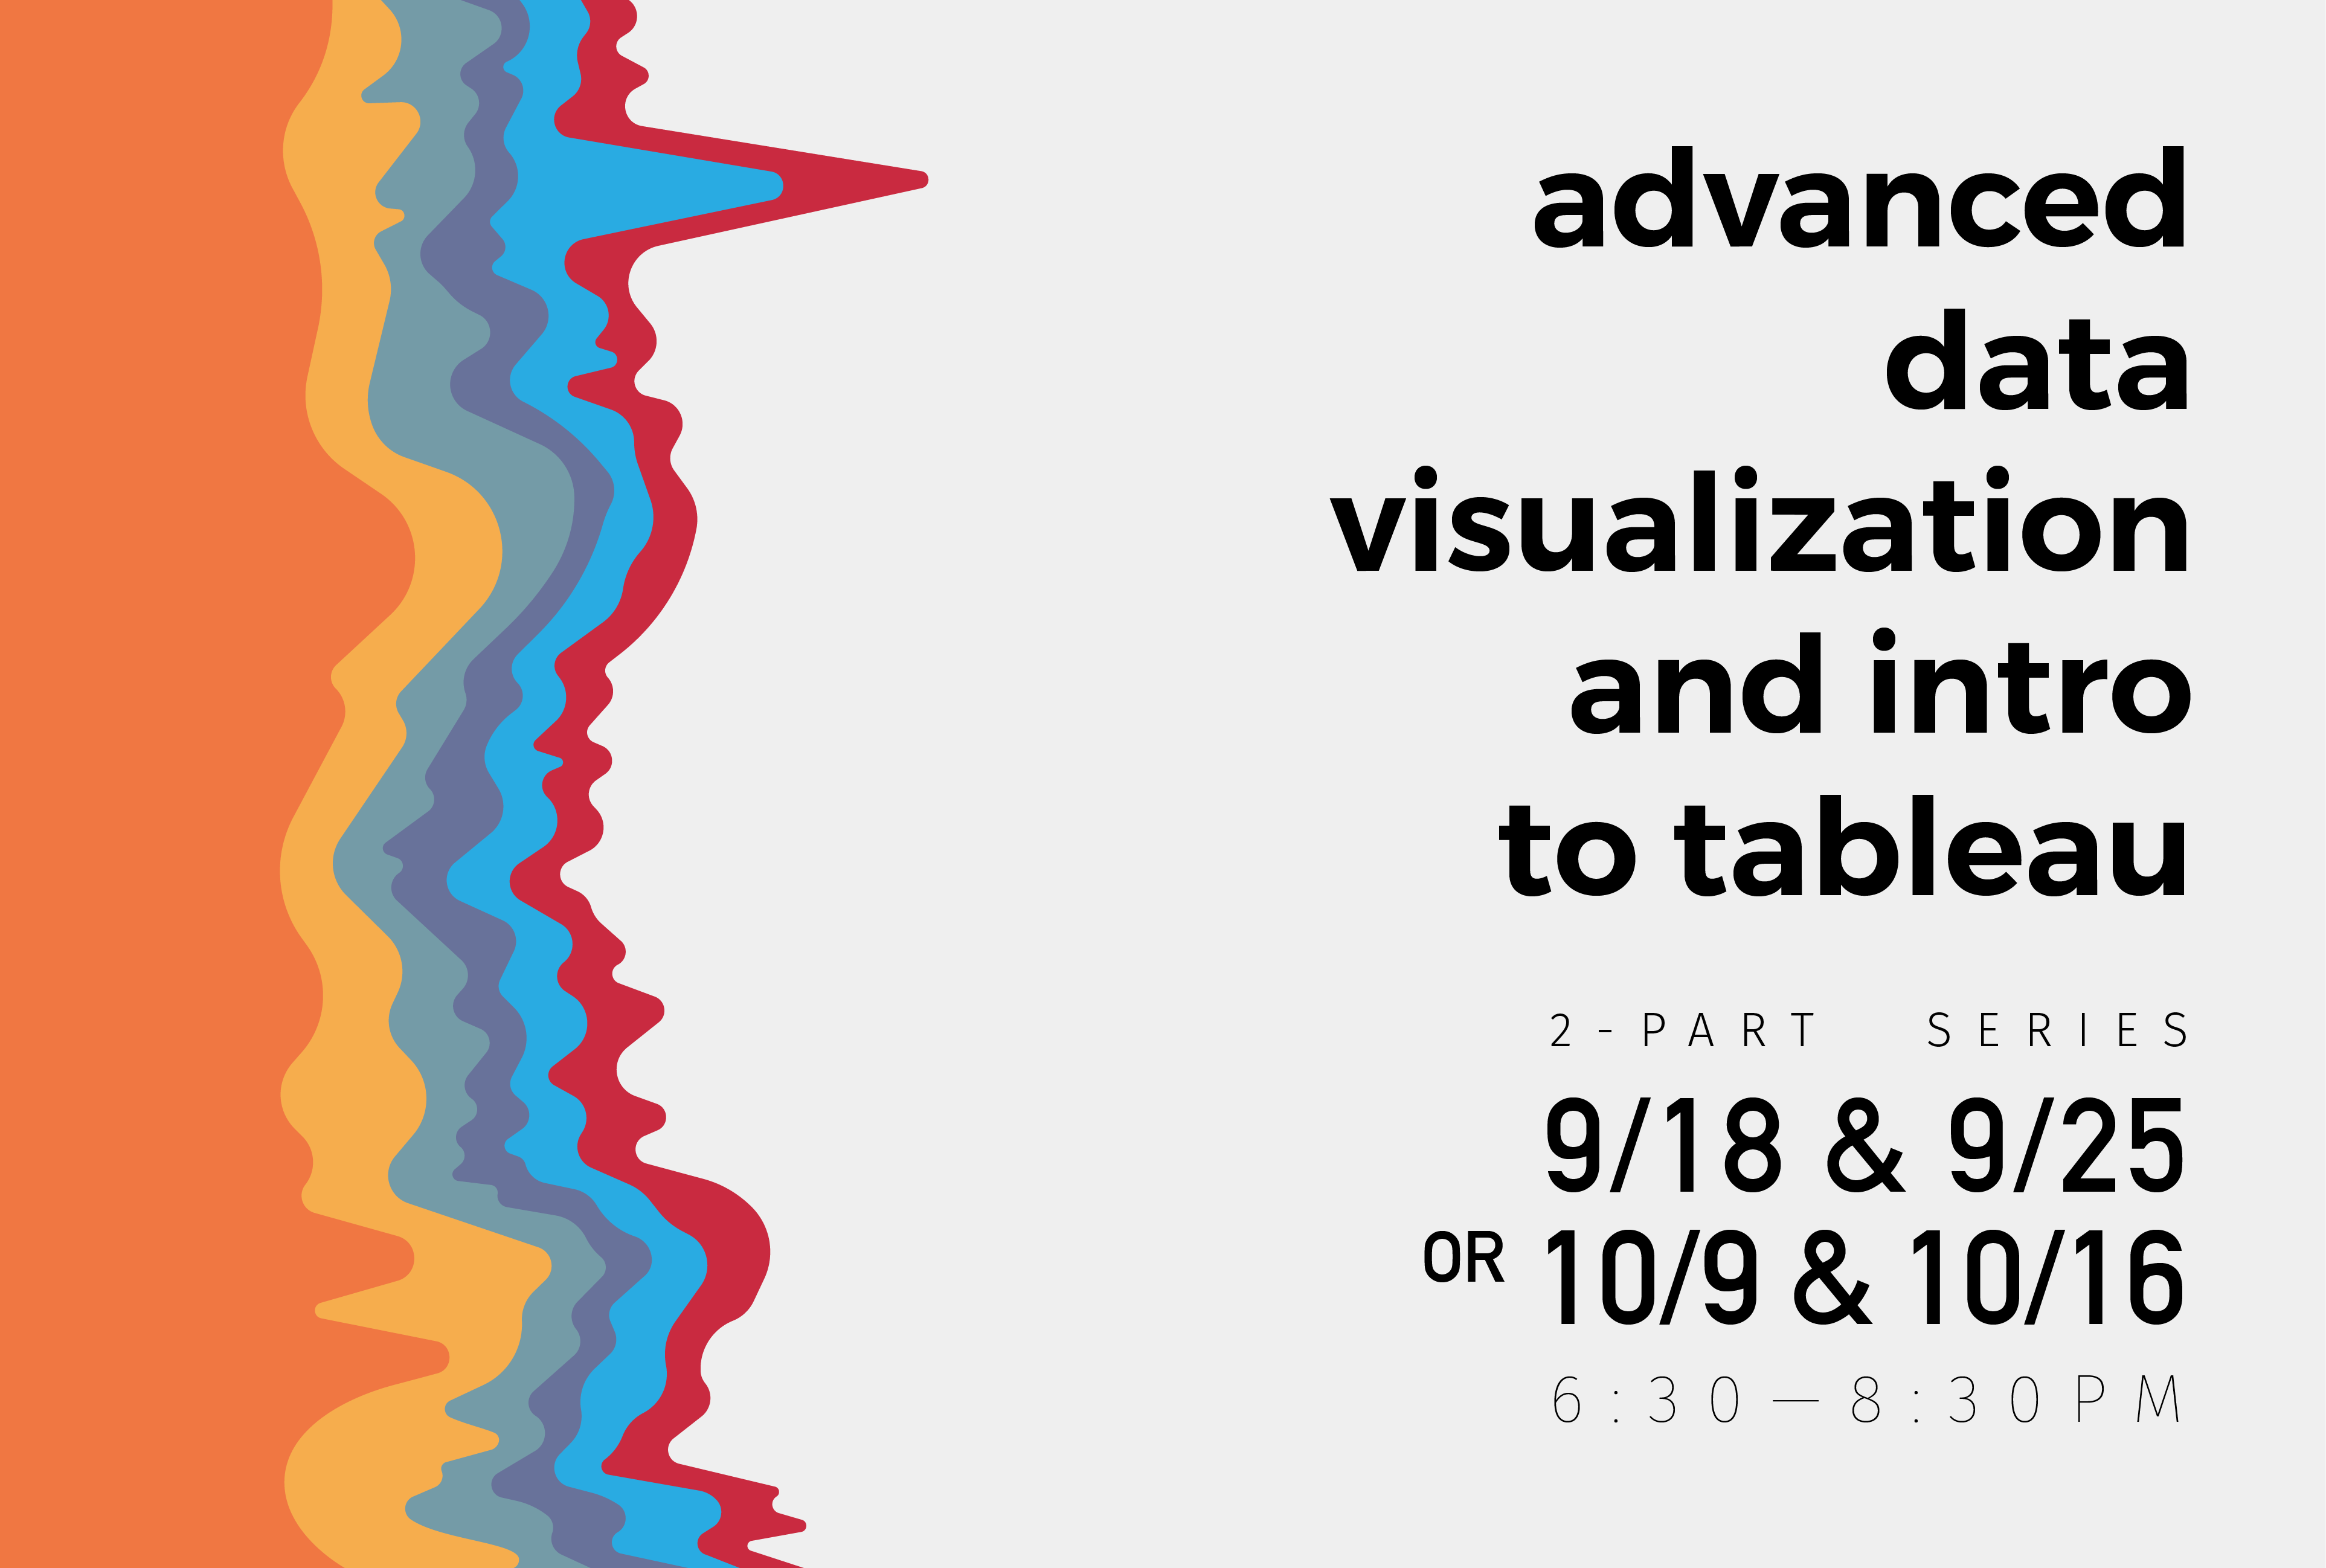
Advanced Data Visualization and Intro to Tableau – Part 2
October 16, 2017 @ 6:30 pm - 8:30 pm
For more updates on this event, check: https://www.facebook.com/pg/AnnenbergDL/events/
We live in a world with overwhelming amounts of data. In the second part of this workshop, you’ll learn how to get the most out of this data with more advanced Tableau’s techniques. In this class, we will dive deeper into chart types learned in the intro class, understanding how to customize them to meet their needs. We will also discuss chart selection and understanding which type of business problem should use which type of chart. We will cover complex principles of data visualization, look at how data viz can be used to convey a message, and walk through the process of creating complex, dynamic visualizations.
Last but not least we will use calculated fields to develop more advanced customized reporting through data visualization and combine all learnings from both workshops to create three completed dashboards for your portfolio.
Takeaways:
· Filters, Parameters, and Calculations
· Creating Dashboards
· Advanced Visualizations
· Maps with Tableau
· Customization
· Publishing with Tableau
· Tableau Desktop vs. Tableau Web vs. Tableau Reader
Prereqs:
Please bring a laptop with Tableau Public (free) pre-installed Please download the data set for the workshop that will be sent out prior to class
Instructor: Juanita Rodriguez
Note: This is the second part of a 2-part series. Don’t forget to RSVP to the first part!