


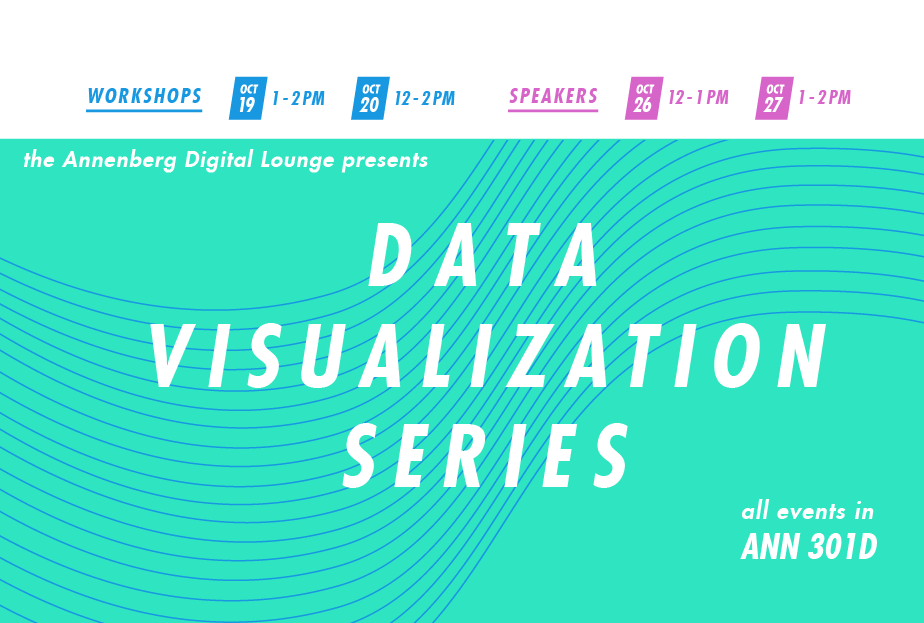
Our newest #OnTheDL event series will focus on the exciting world of data visualization! This type of visual communication is essential in communication and journalism today, as it allows decision makers to easily understand analytics, grasp difficult concepts, and identify new patterns.
Visit the FB event and click attending for our updates and reminders: http://bit.ly/datavisonthedl
Experts from LA Times, Graphiq, and Annenberg will guide you to become a data vis expert! Check out our 4 events below.
Talk Pretty to Me, Data: Getting Numbers On-The-Fly
Oct 19th, 1pm – 2pm
Instructor: Chimene Tucker, Annenberg Librarian
In this hands-on session, Chimene Tucker, our Annenberg librarian, will help make you a whizz at finding numbers and data through our USC Library resources. We’ll take all those numbers and show you how to turn them into beautiful visualizations on-the-fly using infogr.am.
Adobe Illustrator: Creating Custom Infographics & Charts
Oct 20th, 12pm – 2pm
Instructor: Erika Hang, Design Specialist
Now that you’ve learned how to get numbers on-the-fly, learn how to make your own custom infographics and charts in Illustrator. Contray to popular belief, you don’t need to be an illustrator to use Adobe Illustrator! Erika Hang will show you how easy it is to start playing in Illustrator.
How I Got That Data Story
Oct 26th, 12pm – 1pm
Speaker: Ben Poston, LA Times
Get the inside scoop from Ben Poston, an LA Times reporter, on how he became a data reporter and how the LAT data desk works. He’ll talk about how they create data stories and delve into their recent interactive map and story on Los Angeles’ pavements.
How Data Can Make You A Smarter Journalist
Oct 27th, 1pm – 2pm
Speakers: Natalie Morin & Nick Selbe, Graphiq
Journalism today is saturated with hot takes. Too often, reactionary, opinionated pieces are written with little to no regard for unbiased, objective reporting — especially in more subjective topics, like sports and entertainment. How do we combat the hot take? With a “smart take,” using data. Come learn how numbers can play an important role in elevating discussion and how you can use them to your advantage, no matter how numbers-savvy you are.
Seating is on a first-come, first-served basis (with priority given to Annenberg students) in ANN 301D.