


Topics
Download this tutorial as a PDF here.
Introduction
Web analytics is a study of online behavior in order to improve it. Google has a really useful tool called Google Analytics which can be used to help you understand how your website is performing and what areas need improvement. In this tutorial we will go over some basics of how to use the Google Analytics.
Installing Google Analytics
Before we can install Google Analytics, we first need to get a Google Analytics account. For that visit http://www.google.com/analytics/ and click Create an account.
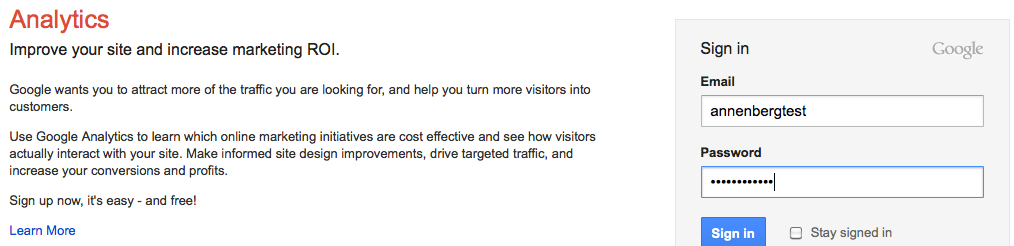
Sign in with your gmail or Google account. (If you don’t have one, click the red Sign Up button on the top right.
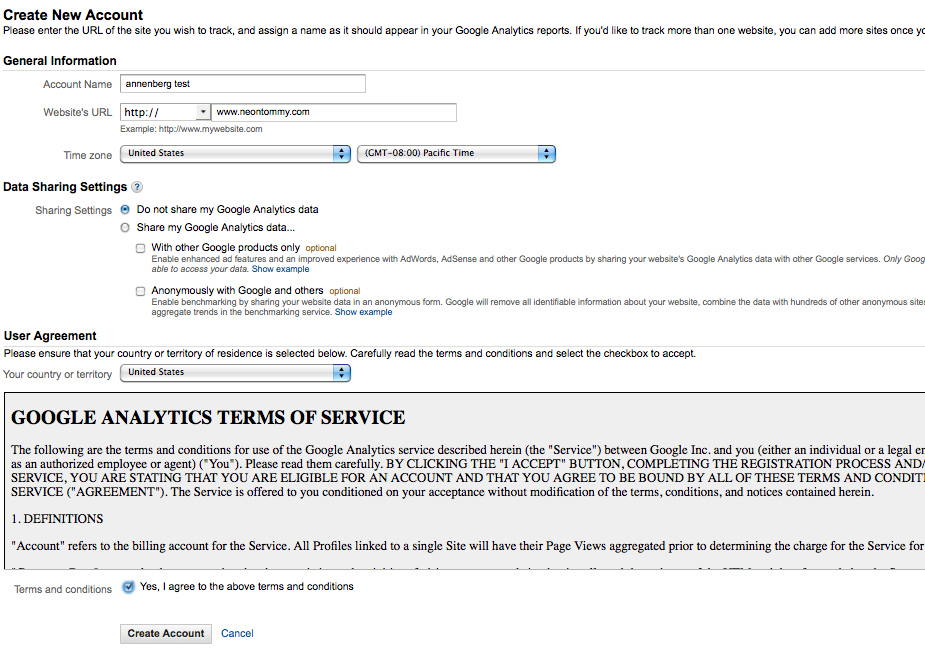
This will take you to a “Create New Account page” where you will type in an Account name, and your Website URL. And fill in the other details and click Create Account.
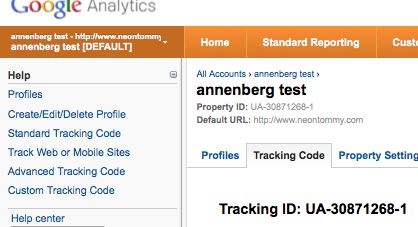
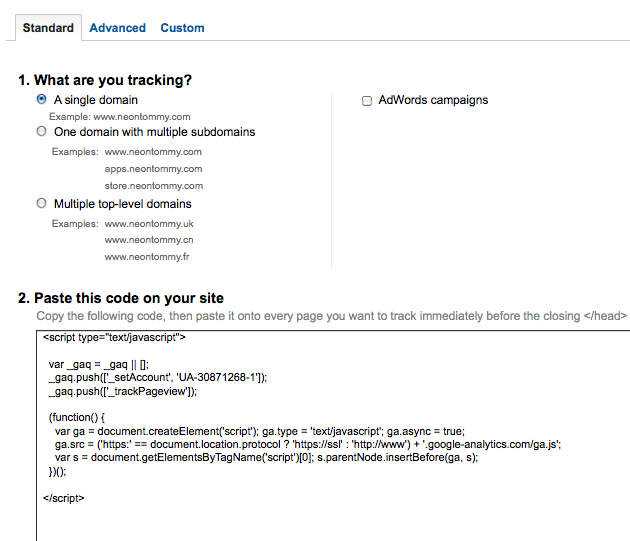
Once the account is created, you will be taken to a page that gives you the Tracking Code. If you don’t see it on the upper left corner click your account name (here Annenberg test) and that should get you on a page that will give you the code.
Depending on what type of domain you have, select the appropriate radio button and then Copy the given tracking code and paste it onto every page before the closing tag. For Content Management System users such as WordPress and Drupal, you only have to paste it once to the appropriate header file. After that is done, you will start seeing your analytics.
Visitors Overview
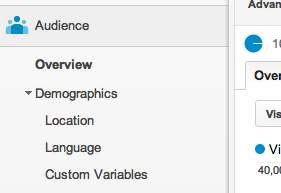
Google analytics allows you to analyze your visitors over the time period of your choice. To do so, click Audience on the sidebar and in that click Overview.
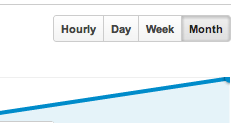
To view data over a month or a week click the appropriate option on the upper right corner of the visitor’s graph.
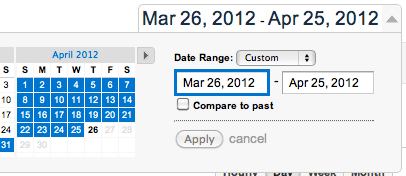
To go back and view data from the past months then make sure you change the date Range. This can be done by changing it from the drop down menu right above the visitor’s graph.
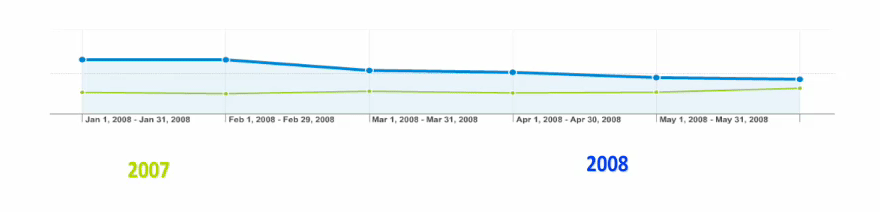
By checking Compare to past you can compare two date ranges. So let’s say you want to compare the visitors in January during current year and past year, the Compare option allows you to do.
While comparing date ranges take into consideration the time period you are selecting. So lets say you have a shopping site and want to compare January with July. This won’t be an ideal apple-‐to-‐apple comparison because January is holiday season.
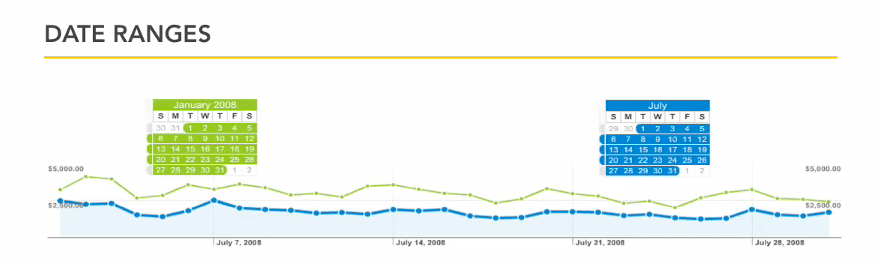
But what you can do is try to see the difference in sales over a longer period of time. Looking over yearly data would help and know if the difference is every year or is the gap closing.
The Visitors graph allows you to compare different metrics. So let’s say you want to see how many pages did the user visited when they were on your website. To do so, on the upper left corner of the visitors graph you can see a Visits vs. Select metric option. Using the drop down menu select the pages/Visit option and you will see the required results.
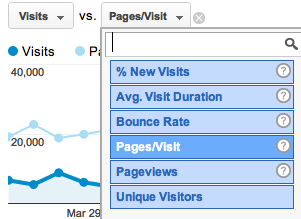
There are other metrics such as Unique visitors and Average time duration spent on your website. You can play around and at anytime if you don’t know what a particular metric means you can click the small Question mark icon to the next of each option.
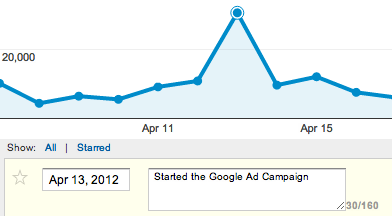
Also there is an option to create annotations to make notes in data. To do so click the lower arrow right below the graphs as seen in the picture and then you will see an option to create a new annotation.
You can select the date and then type in a note. This can help to keep notes for you to explain certain data features. Here we started a Google Adwords campaign on April 13th and so the number of visitors increased. It will be good if I keep a note to myself so after a few years when I revisit the data the annotations can remind me.
Find Your Visitor Demographics
Google Analytics allow users to find information about where your site’s visitors are coming from. To do so, on the sidebar select Demographics and under that select Location. You will see an interactive map, which will show you where your visitors are located. The darker the area, the more visitors you are getting from that area.
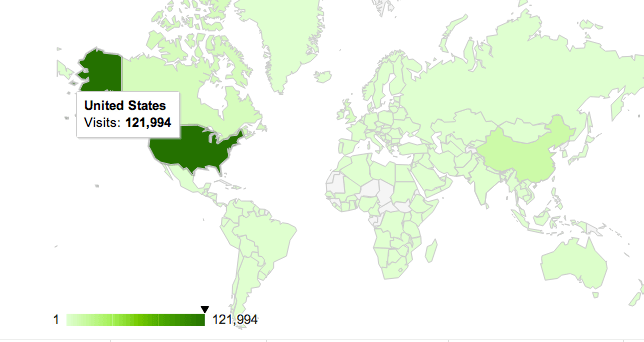
The graph also allows you to select different metrics, so for example you can find the Bounce rate (i.e. visits in which the person left your site from the entrance page) in different areas. Again if you don’t know what a particular metric means then click the small Question mark icon next to it and it will explain its meaning.
Effective Keywords
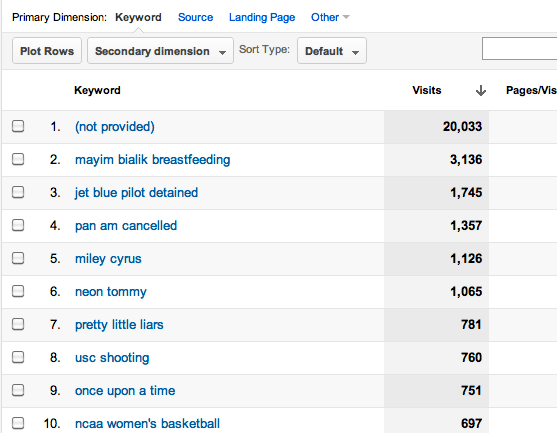
Google analytics allows you to analyze what keywords bring you the most visitors. Such data is useful for Search Engine Optimization and Ad campaigns that are based on keywords.
To find out what keywords, navigate to search option under Traffic Sources on the sidebar. From that select Organic and you sill see a page that list the top keywords in a descending order.
If you have Ecommerce on you site you can click the Ecommerce tab right about the visits graph and it will show you the revenue a particular keyword bought over the given date range.